What's New
Fiscal Forum: Half of Alaska’s Recent Growth Came From Washington
At a forum co-hosted by ISER and Build Alaska’s Future, three University of Alaska economists sized the federal government’s grip on the state economy. The engine they described is now running in reverse on the one side we can actually measure.
ANCHORAGE (06/23/26) — Forum Summary by Ross Johnston, Executive Director
Online forum, June 23, 2026. Co-hosted by Commonwealth North, Build Alaska’s Future, and the University of Alaska Anchorage’s Institute of Social and Economic Research (ISER). Presenters: Bob Loeffler, Brett Watson, and Brock Wilson.
Watch YouTube Below
Half.
That is the share of Alaska’s economic growth over the past decade that traces back to a single source. Not oil. Not fish. Federal spending.
That number framed everything else three economists laid out this week, and it cuts against the story most Alaskans tell about their own economy. We think of ourselves as an oil state, a fishing state, a state that runs on resources pulled from the ground and the sea. The data the presenters walked through tells a quieter and more uncomfortable story. Over the years Alaska spent climbing out of recession, the largest single engine of its recovery sat in Washington. And that engine, on the one side we can currently see clearly, has begun to contract.
The Bucket
To understand why half is the right number, you have to start with the lens the forum used to see the economy, because it is not the obvious one.
Bob Loeffler, a professor at the University of Alaska Anchorage, opened with a sketch of Alaska’s economy as a leaky bucket. Money pours in from outside whenever the state sells something to the rest of the world, and money leaks out every time an Alaskan buys something made elsewhere. The water level depends on the balance between the two flows.
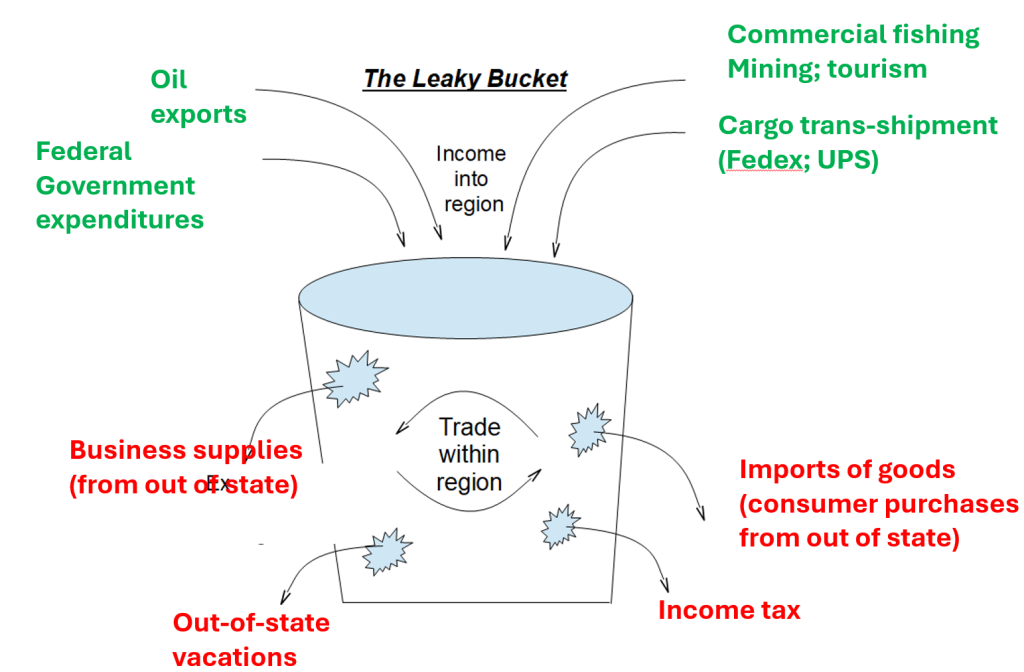
Roughly a third of the money pouring in, Loeffler estimated, comes from the federal government. And here is the point that gives the model its bite: you do not have to work for the federal government to depend on it.
Take a piano teacher. None of her students work for the federal government. Neither do their parents. And yet she does, because a federal paycheck spends at the hardware store, which spends at the coffee shop, which spends on piano lessons. By the time the water has circulated through the bucket, a third of what powers the whole thing entered through one tap.
That reframing changes how you weigh an industry’s importance. The instinct is to measure a sector against the whole economy. Loeffler argued the better denominator is the share of new money a sector brings in from outside, the water entering the bucket rather than the water already sloshing inside it. Measured that way, the federal government is the largest single source of new money in Alaska, ahead of oil and gas, with fishing, mining, tourism, air cargo, Permanent Fund earnings, and retiree pensions trailing a good distance behind.
The Biggest Leg
So how big is the federal leg of the stool? Brett Watson, associate professor of applied and natural resource economics at ISER, put numbers to it over a specific and consequential window: 2015 to 2023, the years Alaska spent clawing out of one recession only to stumble toward another.
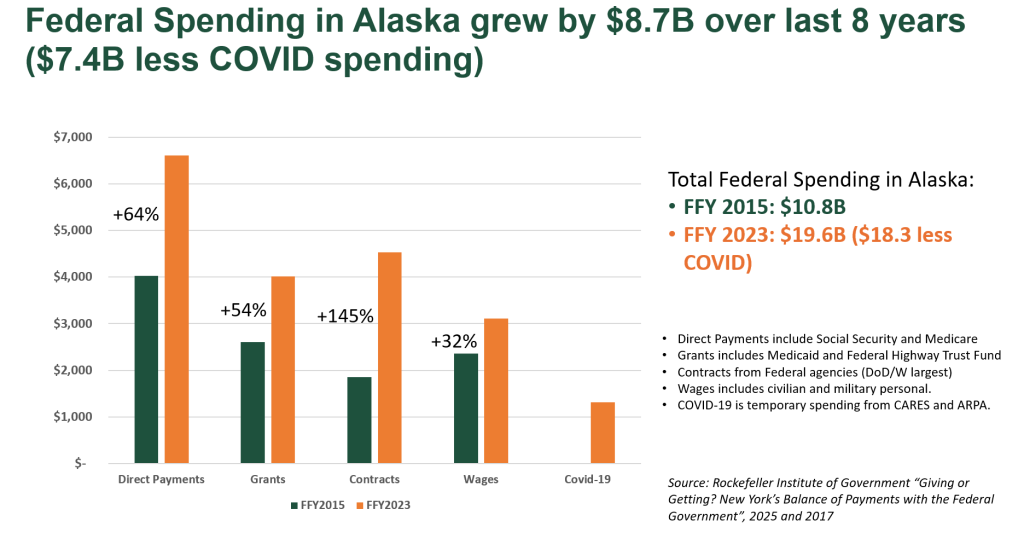
Over that stretch, federal spending in Alaska grew by about $8.7 billion in nominal terms, from just under $11 billion to just under $20 billion. Strip out temporary pandemic spending and the figure lands near $18 billion. The growth was not evenly spread across the kinds of money Washington sends north. Watson broke the 2023 total into its major channels:
- Direct payments: about $6.5 billion. Social Security and Medicare, the largest single category, flowing to individual Alaskans.
- Grants: roughly $4 billion. Including the Medicaid dollars that climbed after Alaska expanded eligibility under the Affordable Care Act.
- Contracts: about $4.5 billion. The fastest-growing piece by far, up 150 percent over the period, much of it Department of Defense procurement for construction, utilities, and goods bought from Alaska communities.
- Wages: about $3.1 billion. The federal civilian and military payroll, which Wilson would return to in detail.
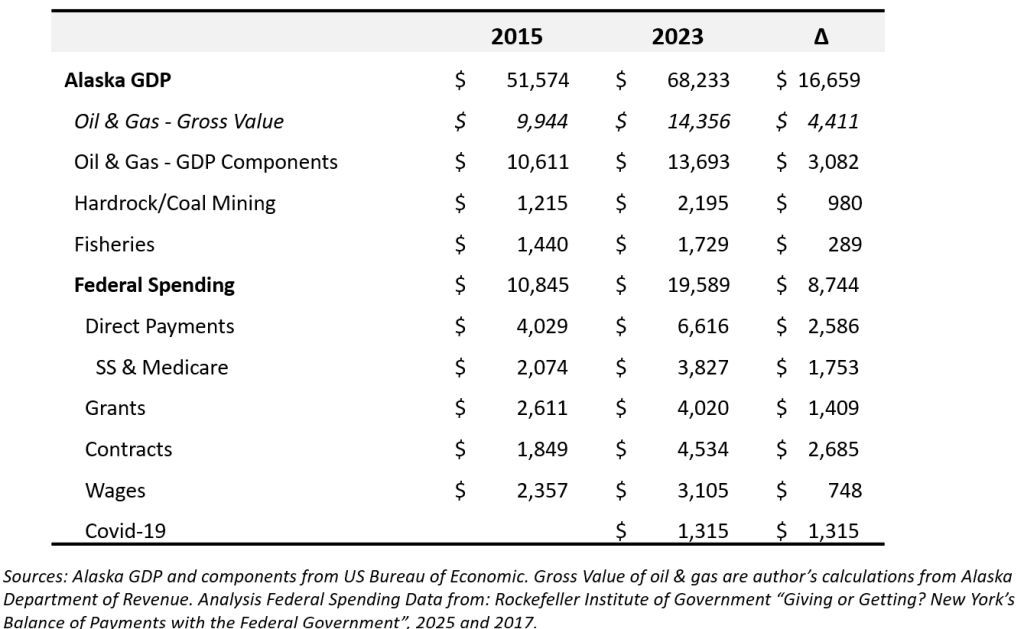
Then came the comparison that anchors this summary. Alaska’s gross domestic product grew by roughly $16.5 billion between 2015 and 2023. Federal spending grew by just under $9 billion across the same years. Set those side by side and about half of the state’s total economic growth over the decade was federal spending growth. For scale, Watson placed oil and gas, the state’s second-largest source of new money, at between $3 billion and $4.5 billion of growth over the same window. Mining grew by just under a billion. Fishing, by roughly a quarter of that.
The federal leg, in other words, did not just hold steady while the others carried the state. It did most of the lifting.
Where It Pools
A leg that large still does not press evenly on the floor. Federal money lands in particular places, and the map matters as much as the total.
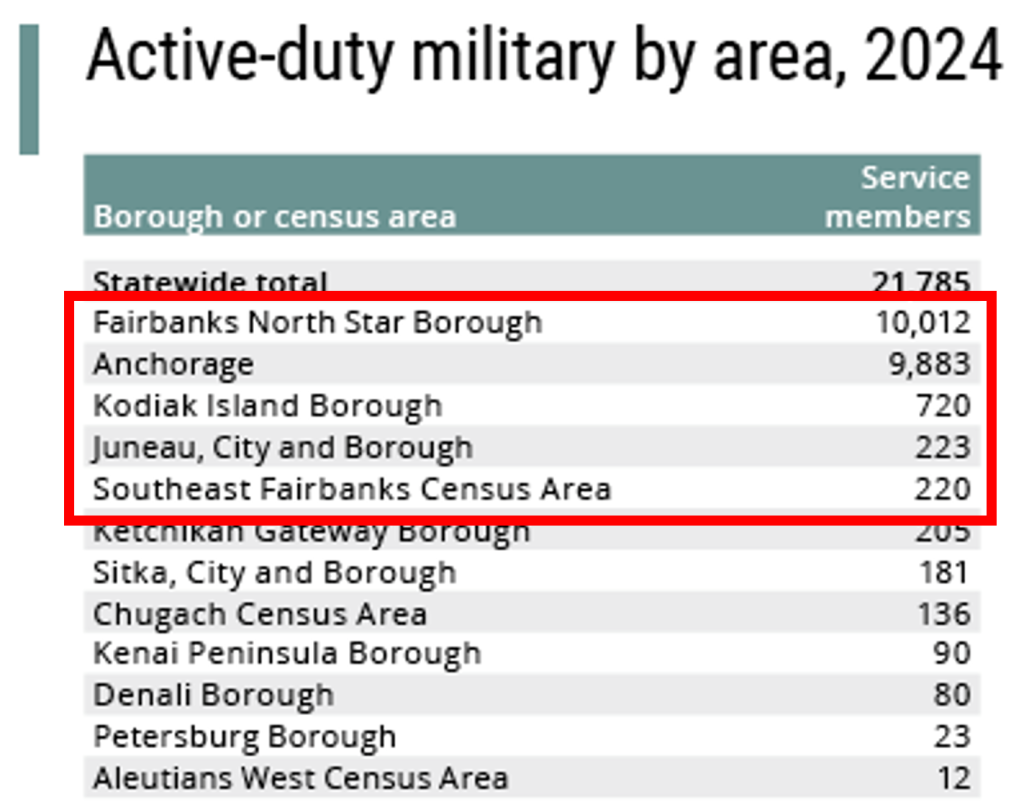
Military spending concentrates at the hubs. Eielson and Fort Greeley near Fairbanks, JBER in Anchorage, the Coast Guard base on Kodiak. The civilian map tells a subtler story, and this is where two presenters’ data fit together. Wilson noted that if you ask where Alaska’s federal civilian workers physically sit, 53 percent are in the Anchorage area and 21 percent around Fairbanks, which makes the workforce look like an urban phenomenon. Loeffler’s maps, measured as a share of each area’s total jobs, flip that impression on its head. Denali shows up dark because of the national park. Hoonah, because of Glacier Bay. Southeast Fairbanks, because of the civilians who support the military there.
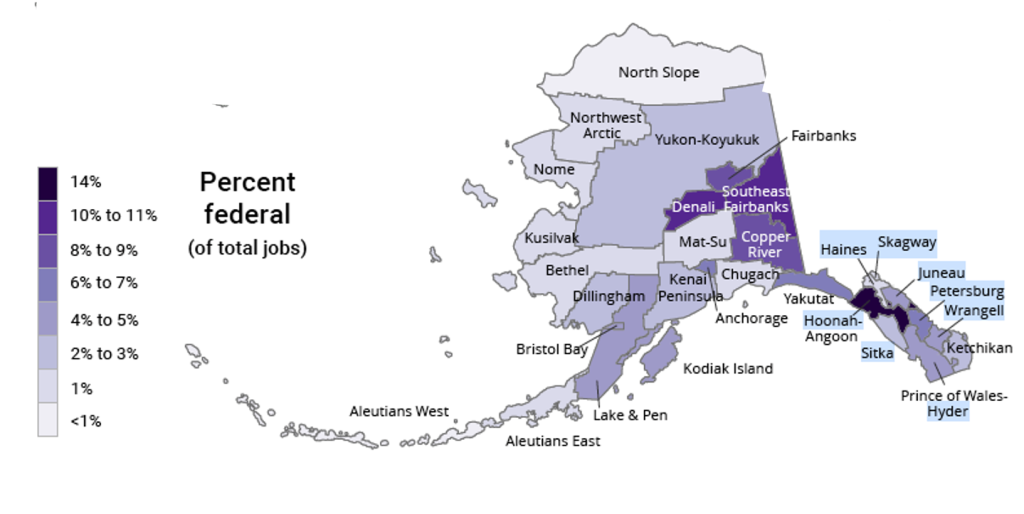
And in much of rural Alaska, Loeffler observed, the single largest civilian federal employer is the local postmaster.
The synthesis is the part worth holding onto. The raw headcount is urban. The dependence is rural. The communities where federal jobs make up the largest slice of the local economy are precisely the small ones with the least to fall back on, which means a national decision to shrink the federal workforce does not land where the workers are clustered. It lands hardest where they are most load-bearing.
The Instruments Are Dark
Veronica Slajer of Build Alaska’s Future asked the economists a plain question. Has it gotten harder to find out what the federal government is actually doing in Alaska? Watson’s answer was unguarded. ISER itself holds federal research grants, and even it struggles to learn the status of its own funding, often relying on unofficial conversations with program officers. Replicating that exercise across every grant and contract recipient in the state, he said, is nearly impossible. McKinley Research Group has attempted a version of it for the construction industry through large-scale surveys, contractor by contractor, asking whether the money arrived. It is grueling work, and it covers one sector.
This is why the two halves of the forum sit slightly out of step in time, and it is the asymmetry every reader should carry away. Wilson’s workforce data runs nearly to the present, because federal personnel records were finally pried loose. Watson’s spending data stops at 2023, because that is the most recent year anyone can apportion with confidence.
We can see, in fresh detail, the experienced people walking out the door. We cannot yet see what is happening to the far larger flow of federal dollars that does not move through a payroll.
We simply do not know what got spent last year.
The Tide Goes Out
Brock Wilson, research assistant professor of economics at ISER, carried the story up to April 2026.
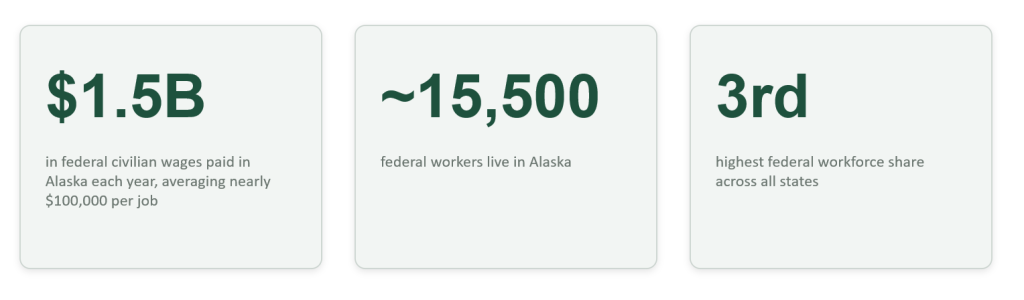
Alaska is home to roughly 15,500 federal civilian workers earning about $1.5 billion a year, nearly $100,000 per job. Among all fifty states, Alaska ranks third in reliance on federal workers as a share of its workforce, behind only Maryland and Hawaii. The capital region and Alaska, Wilson observed, sit in the same uncomfortable bracket. National decisions about the federal workforce fall harder here than almost anywhere else.
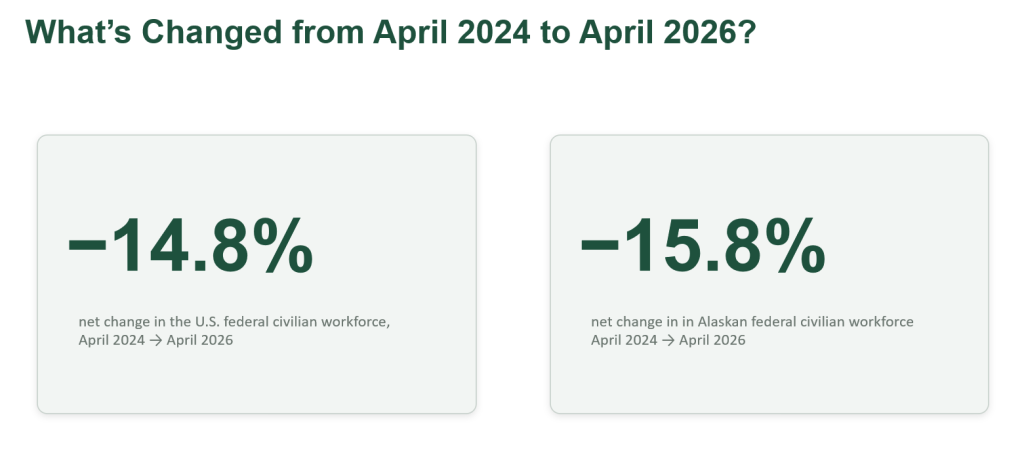
Between April 2024 and April 2026, the national federal civilian workforce fell 14.8 percent on Wilson’s matched measure, which excludes Defense, Homeland Security, and Justice for consistency. Alaska fell further, by 15.8 percent. One of the steeper declines in the country.
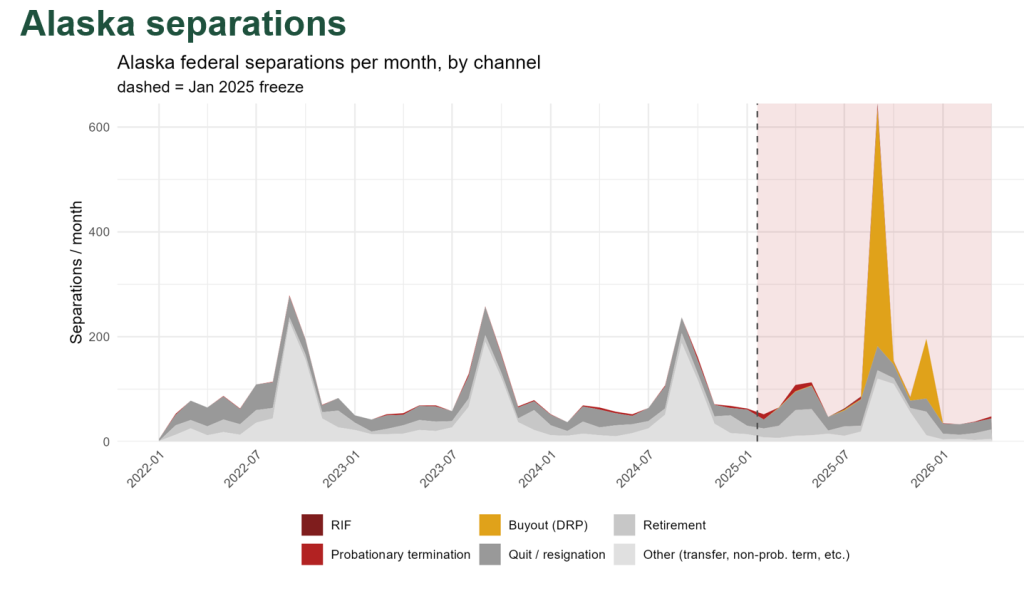
But the shape of Alaska’s decline is the finding that deserves the spotlight, because it diverges sharply from the national headline. The probationary firings and reductions in force that drove the news cycle were aimed largely at the capital region. By Wilson’s accounting, only about half a percent of Alaska’s federal workforce was cut through those involuntary tools, against 4.3 percent in Washington, D.C. Alaska did not get fired. Alaska took the buyout.
And the people who took it were not the newest or the most marginal.
They were, on average, ten-year veterans. Experienced workers carrying institutional knowledge that, as Wilson cautioned, will not be quickly replaced.
What Experience Costs
Here the workforce numbers stop being an accounting exercise and start being a question about capability, and a second analytical thread, drawn partly from the Q&A, deepens it.
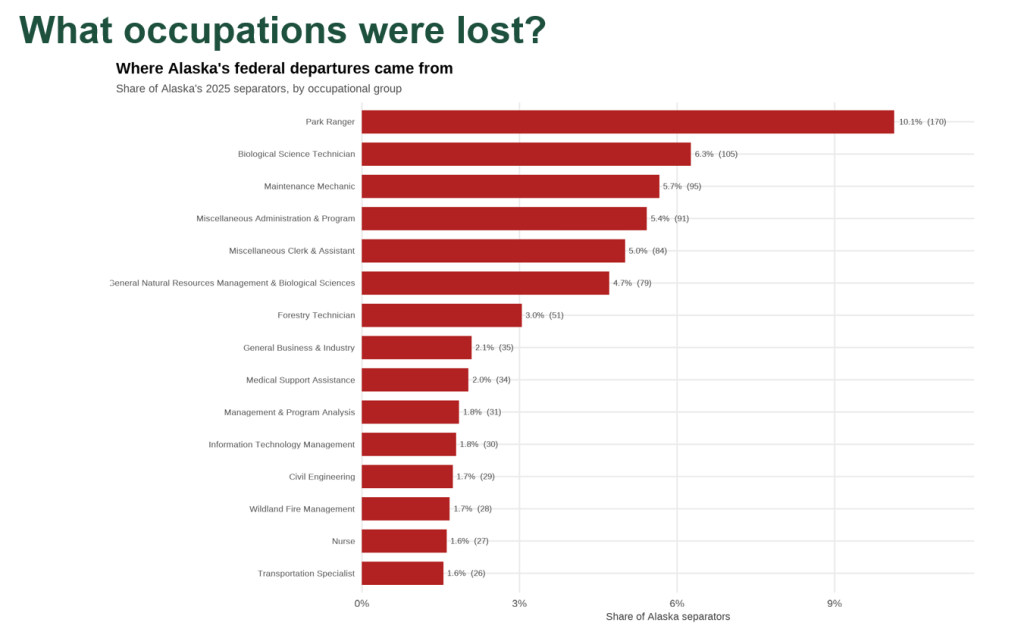
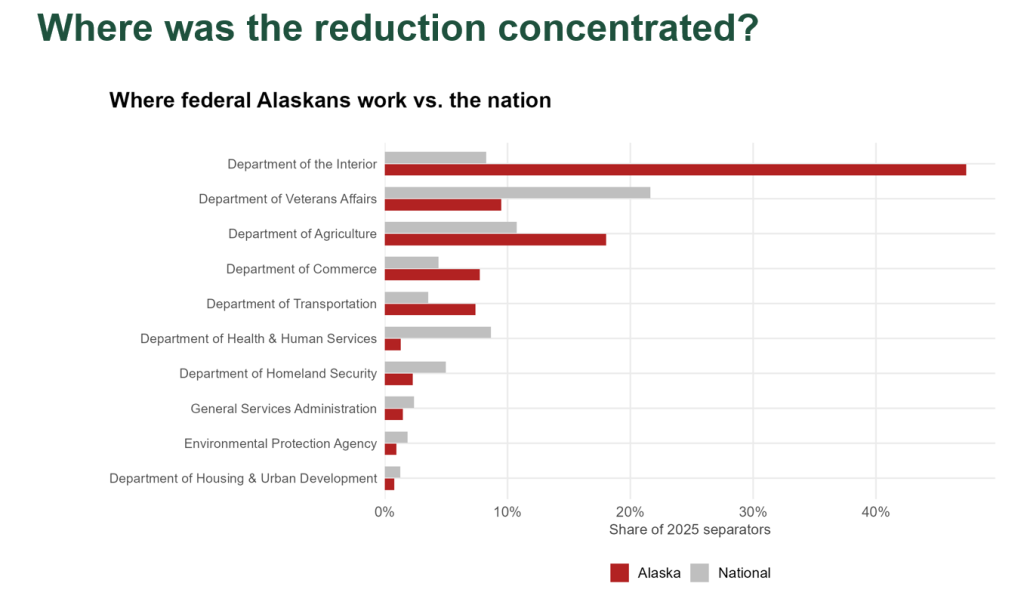
Look at which jobs left. Not the administrative offices. The agencies losing the most were Interior, Agriculture, Commerce, and Transportation, and the work was field work: park rangers, biological science technicians, maintenance mechanics, forestry technicians. The hands that keep public lands and federal facilities functioning.
That detail reframes the loss, because of a point Wilson made when asked whether private industry might simply absorb the displaced federal work. He cautioned against the assumption. The federal workforce, he argued, is better understood as a complement to Alaska’s basic industries than a substitute for them. Cruise passengers come to see Denali. If there are no rangers to keep Denali accessible, the cruise economy feels it too. A shrinking federal presence, on that logic, can pull private activity down with it rather than clear space for it to rise.
Refilling the Bucket
If the federal tide is going out, what flows in behind it? The forum’s forward-looking thread, almost all of it surfacing in the Q&A, sketched the candidates without overselling them.
Loeffler was candid about where Alaska’s economic talents genuinely lie. The state is passable at growing tourism, oil, and mining, he allowed, but what Alaska is truly good at is extracting money from the federal government through the work of its congressional delegation, whoever holds those seats. He pointed to a run of recent federal moves in critical minerals: a federal equity stake in Trilogy Metals in the Ambler district, grants accelerating Graphite One near Nome and NOVA Minerals’ antimony work toward a processing facility near Point MacKenzie, and the Terra carbon-capture project southwest of Skwentna. He and Watson openly disagreed on the size of the Terra figure, somewhere between $45 million and $80 million, a small but honest reminder of how provisional these numbers remain.
On contracting, much of which moves through Alaska Native corporations, Loeffler offered a striking statistic. Among the top ten Department of Defense contractors in the state, five are Alaska Native corporations, led by ASRC and Doyon. New money, in this case, that is also Alaska-headquartered and Alaska-owned.
Other prospects drew lighter treatment. Coast Guard icebreakers may home-port in Juneau, Kodiak, or Nome, and a new fighter wing is bound for interior Alaska. Watson made the useful point that such investments look trivial at a statewide scale yet land enormously on the small communities that host them. And the Rural Health Transformation Fund, Watson estimated, will deliver on the order of $250 million a year for several years, real money that nonetheless amounts to a fraction of the roughly $9 billion in growth the state saw over the prior decade, and that was designed partly to offset Medicaid reductions still working their way through.
What the three economists could not tell us is what the bucket looks like right now. The spending data lags by years. The workforce data, fresher, shows experience draining out. The decisions that determine whether that water gets replaced, by minerals or icebreakers or something not yet on any map, are being made in real time, with the meters running and the gauges a year or two behind.
That is the harder thing to sit with. Not that the numbers are bad, but that for now we are flying with the instruments partly dark.
This summary is a recap of the information presented. It is not an official record, transcript, or position statement. The content reflects only the views and statements made by the individual presenters and participants at the time of the forum. It should not be interpreted as representing the official views, opinions, policies, or positions of Commonwealth North, its leadership, board members, staff, or affiliates.
Reference Materials